July 2025 NYC Real Estate Market Report: Trends, Insights & Analysis
July 2025 brings steady momentum to Manhattan’s housing market, with subtle shifts beneath the surface. Buyers are quicker on renovated listings, sellers test higher prices, and rental inventory is quietly rising. Key metrics—inventory, absorption, pricing—reveal where the market may be headed. This report unpacks July’s trends to show what’s moving, where leverage is shifting, and how to navigate the coming months. Whether you’re eyeing a co-op uptown or a condo downtown, these insights help you move with confidence.
Inventory & Supply
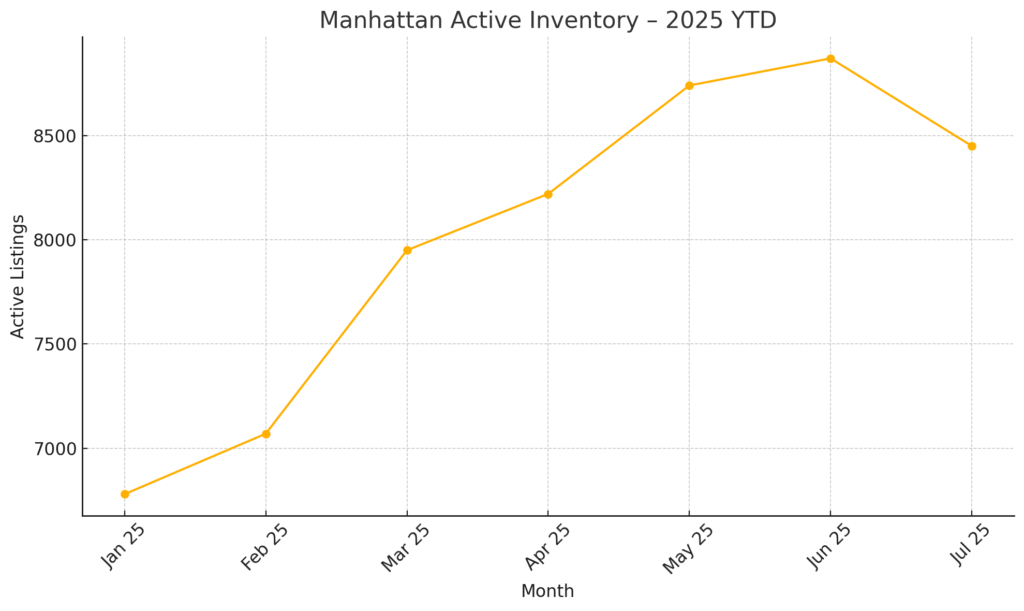
Active supply slid from 8,870 on June 23 to 8,450 on July 22 while 304 Private Exclusives and 115 “Make Me Sell” owners hover off-market. New-listing flow also thinned: only 1,200 homes hit the market in the last 30 days—barely half the April peak of 2,200. With months-of-supply unmoved at 7.2, Manhattan remains technically balanced, yet stock now sits seven percent under the 2024 summit. Seasonally, inventory usually drifts lower into late August, so buyers relying on “new this week” alerts will find slim pickings. Best move: watch for price-improved listings and bid fast on renovated units. Sellers debating timing can launch in August amid lighter competition or bank on September’s larger audience—provided marketing assets are ready to drop day one.
Demand & Absorption
Contracts are quietly soaking up supply. June recorded 888 resale agreements, nudging 0.57 percent above the long-term June average and pushing year-to-date activity 3.64 percent over trend. Net inventory rose only 121 units in July, sealing a 24.6 percent year-over-year decline in excess supply. If new listings remain muted, absorption models project months-of-supply could dip below six by November—shifting leverage to sellers just as holiday distractions kick in. Buyers who need financing should lock rates early; every drop beneath 6.5 percent has triggered a mini bidding spurt this year.
Pricing Pulse
Sellers still hold the line: the median discount sits at 3.9 percent, scarcely different from June and narrower than last summer’s norms. Price-per-square-foot holds at $1,430, down just 0.2 percent month-to-month but 1.4 percent higher year-over-year. Owners unwilling to adjust simply withdraw—off-market removals climbed eight percent in July. Opportunity favors two buckets: listings older than 90 days and homes needing six-figure upgrades; both see the deepest concessions. Absent a sudden inventory surge, price firmness should persist into Q4.
Market Velocity
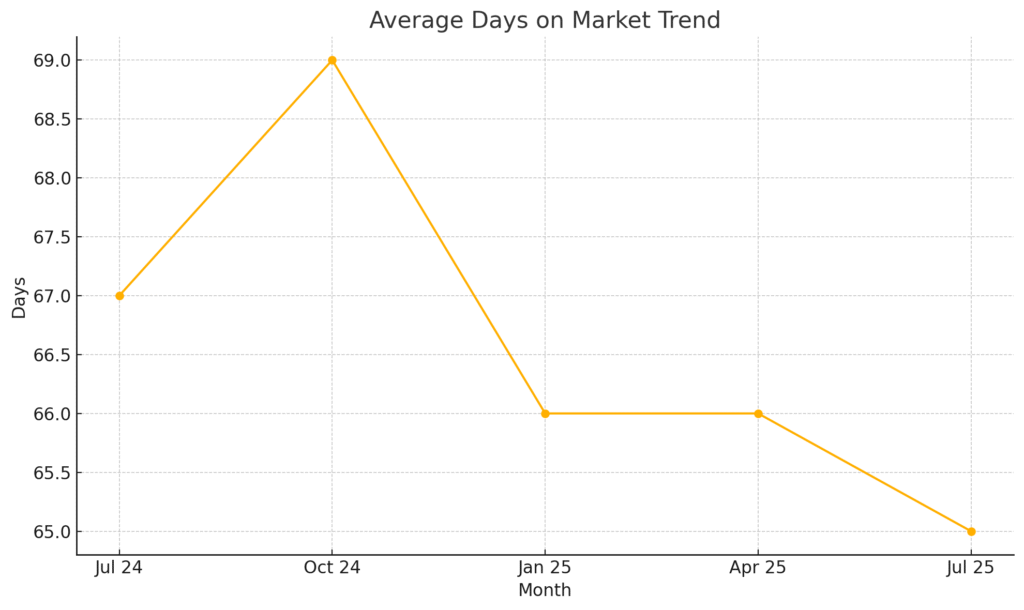
Average days on market shaved two days to 65 in July, three days quicker than the same time last year. Turnkey apartments typically close nine days faster, while heavy-renovation candidates add nearly three weeks. Weekend foot-traffic confirms selective urgency: Manhattan open houses averaged 0.83 parties, versus Brooklyn’s 2.06, on July 19-20. Expect DOM to plateau in August and tighten again post-Labor Day as refreshed buyers return.
Rental Snapshot
Compass rental stock surged from 4,881 on June 23 to 5,774 on July 21—a swift 18 percent jump; StreetEasy climbed to 7,397, while OLR held at 10,776. Even so, median asks remain stubborn—studios $3,350, one-beds $4,450, two-beds $6,000. Landlords above $10 k monthly are blinking first with half-month concessions, yet entry-level units still lease within days. Watch Compass inventory mid-August: historically, once listings top 6,200, renters gain negotiating power by late September.